Select Version of EA Desktop:
When you open Exploration Archives the first thing you see is the Dashboard. The Dashboard uses data visualizations, called widgets which display an overview of the data or data events relevant to your workflow and business responsibilities.
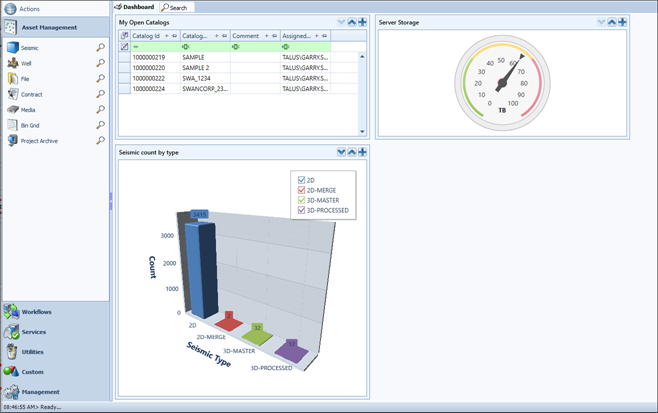
Customized widgets can be created by your administrator based on objectives and requests.
The dashboard normally includes shared elements ensuring that everyone receives the same metrics and analysis for making decisions and managing data with consistency.
The widgets combine data from different areas of Exploration Archives and present a single view of your relevant information by taking complex data sets and converting them into bar charts, line graphs, gauges and tables.
When you open Exploration Archives the first thing you see is the Dashboard. The Dashboard uses data visualizations, called widgets which display an overview of the data or data events relevant to your workflow and business responsibilities.
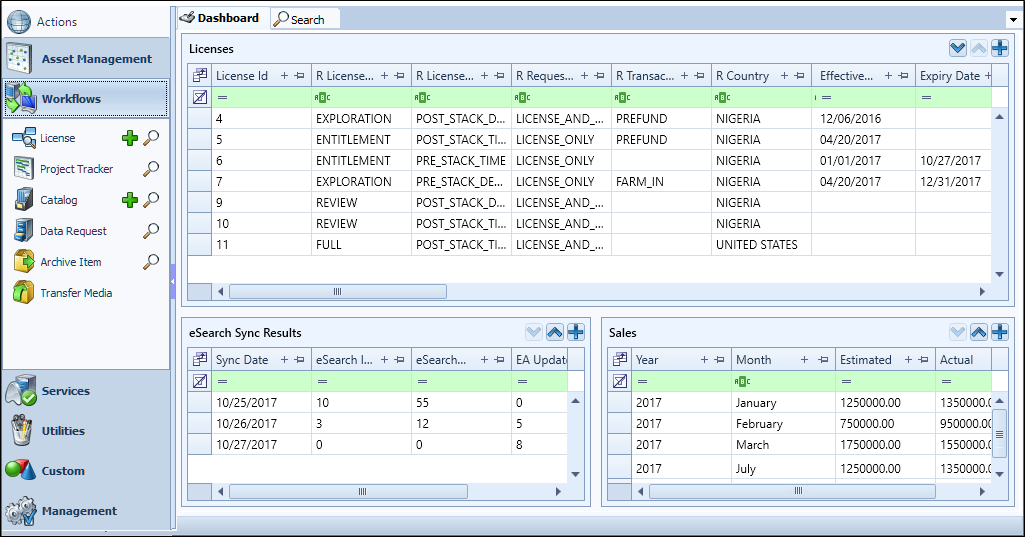
Customized widgets can be created by your administrator based on objectives and requests.
The dashboard normally includes shared elements ensuring that everyone receives the same metrics and analysis for making decisions and managing data with consistency.
The widgets combine data from different areas of Exploration Archives and present a single view of your relevant information by taking complex data sets and converting them into bar charts, line graphs, gauges and tables.